Show the code
library(tidyverse)        # import, tidy, transform, visualize
library(here)             # filepath control
library(gtsummary)        # regresssion tables (with stats)
library(easystats) # everything regressionYou can download the course slides for this section here

source(here("scripts", "01_import.R")) in the chunk---
title: "TITLE"
subtitle: "SUBTITLE"
author: "ME"
date: today
format:
html:
toc: true
toc-depth: 2
embed-resources: true
number-sections: true
number-depth: 2
code-fold: true
code-summary: "Show the code"
code-tools: true
execute:
message: false
warning: false
---easystats and gtsummary packages to the code chunk where you have your library calls.If you need to install any of the packages:
install.packages(c("package_name", "package_name")) to download the packages.library(tidyverse) # import, tidy, transform, visualize
library(here) # filepath control
library(gtsummary) # regresssion tables (with stats)
library(easystats) # everything regressionpalmerpenguins datasetpalmerpenguins packages to the code chunk where you have your library calls.If you need to install the package:
install.packages("palmerpenguins") to download the package.library(palmerpenguins) # Has the 'penguins' dataIf you want to see the penguins data in your environment pane you can add it as an object. You don’t need to do this.
penguins <- penguinspalmerpenguins herepenguins dataset. Let body_mass_g be your dependent variable (y), and investigate how changes in the other variables in penguins impact body_mass_gBuild at least two models
Consider making the formula for one of the models body_mass_g ~ . - What does this do?
Store them as (pen_model1, pen_model2, etc.)
Remember that we are just practicing coding here. Today is about How do we code it. The purpose of this particular exercise is to introduce you to a few very useful functions from the easystats package(s), and to get you started with using lm().
pen_model1 <- lm(body_mass_g ~ sex + species, data = penguins)
pen_model2 <- lm(body_mass_g ~ bill_depth_mm + bill_length_mm + flipper_length_mm, data = penguins)
pen_model3 <- lm(body_mass_g ~ ., data = penguins)$
pen_model1$ and explore the drop down menucoefficients(pen_model1)summary() of one of your modelseasystats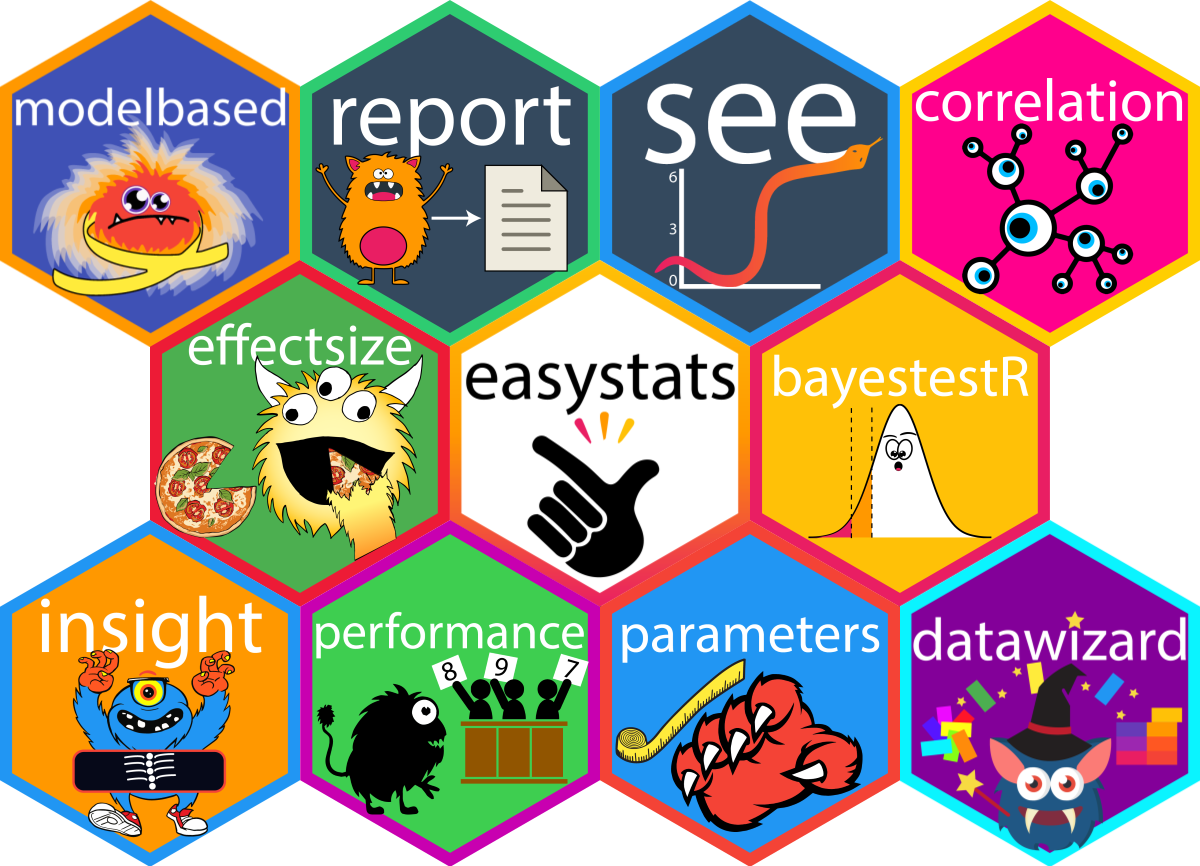
check_model)
check_model(pen_model1)
check_model(pen_model2)
check_model(pen_model3)
model_parameters()model_parameters(pen_model1)
model_parameters(pen_model2, vcov = "HC1")
model_parameters(pen_model3, summary = TRUE)
compare_parameters()compare_parameters(pen_model1, pen_model2, pen_model3) compare_parameters() and plot themcompare_parameters(pen_model1, pen_model2, pen_model3) |>
plot()
compare_models()compare_models(pen_model1, pen_model2, pen_model3)
compare_performance()compare_performance(pen_model1, pen_model2, pen_model3)
compare_performance() %>% plot()compare_performance(pen_model1, pen_model2, pen_model3) %>% plot()
report(pen_model3)
gtsummarytbl_regression() to build a table for one of your models.pen_t1 <- pen_model1 |>
tbl_regression() |>
bold_labels() |>
italicize_levels() |>
bold_p()
pen_t1tbl_regression() to build a table for two more of your models.pen_t2 <- pen_model2 |>
tbl_regression() |>
bold_labels() |>
italicize_levels() |>
bold_p()
pen_t3 <- pen_model3 |>
tbl_regression() |>
bold_labels() |>
italicize_levels() |>
bold_p()tbl_merge() to merge your tablespen_t1_t2_t3 <- tbl_merge(
tbls = list(
pen_t1, pen_t2, pen_t3
)
) |>
modify_caption(
caption = "**Three regression models modeling the body mass of penguins**"
)
pen_t1_t2_t3pen_t1_t2_t3 |>
as_gt() |>
gtsave(here("tables", "my_regression_table.docx"))PhDPublications datasetAER and load the package (+add library call to your library code chunk)AER contains >100 different datasets (to see a list: data(package = 'AER')).PhDPublications, by writing data(PhDPublications)PhDPublicationsPhDPublications, investigate what influenced the number of articles PhD students published during the last 3 years of their PhD.articles what type of data is this?
articles.
articles variable (see plot below).
lm(). Instead you should use glm(, family = poisson())
PhDPublications %>%
  ggplot(aes(x = articles))+
  geom_density(bw = 0.5, fill = "lightgrey", size = 1)+
theme_modern()articles ~ . - What does this do?phd_model1, phd_model2, etc.)easystats functions to work with different model types. The output will automagically adjust. This is a big advantage to other packages and programs.phd_model1 <- PhDPublications %>% glm(articles ~ gender, data = ., family = poisson())
phd_model2 <- PhDPublications %>% glm(articles ~ gender * kids + mentor, data = ., family = poisson())
phd_model3 <- PhDPublications %>% glm(articles ~ ., data = ., family = poisson())$
phd_model1$ and explore the drop down menucoefficients(phd_model1)summary() of one of your models
easystats
check_model)
check_model(phd_model1)
check_model(phd_model2)
check_model(phd_model3)
model_parameters()model_parameters(phd_model1)
model_parameters(phd_model2)
model_parameters(phd_model3)
compare_models()compare_models(phd_model1, phd_model2, phd_model3,
exponentiate = TRUE # To have coefficients as ratios
)
compare_performance()compare_performance(phd_model1, phd_model2, phd_model3)
compare_performance() %>% plot()compare_performance(phd_model1, phd_model2, phd_model3) %>% plot()
report(phd_model3, exponentiate = TRUE)easystats?For more information on easystats read here.