Pain research
Meaning of ‘Smerteforskning’
“Smerteforskning” is Danish for “Pain research”
On these pages you’ll find information about various QST tools we have developed. We share them openly in the hope, that they may serve other researchers well.
Currently the tools in question are:
- a spring operated mechanical pressure pain probe
- a digital calibration platform.
- a VAS-box for collecting time series VAS data
a handheld digital algometer(coming soon)- a number of instructional videos
It is our hope, that by providing detailed instructions on how to manufacture and validate such equipment, it will be easier for interested researchers to get started doing QST research. We do so especially mindful of those researchers with limited resources, who find themselves hindered by the cost of commercially available equipment.
– Søren O’Neill
![]()
The Pressure Pain Probe (3P) was designed as a tool for quantitative sensory testing. More specifically, to allow for assessment of temporal summation of mechanical pressure pain.
The development process has been described in some detail as part of a peer-reviewed publication on the P3s validity as a QST tool. It is available here as an open access publication.
![]()
In said publication, we make recommendations about how best to use the probe to obtain reliable and valid data on pressure pain intensity.
The design details and instructions listed here are released under a Creative Commons license.
This means you are welcome to use it for non-commercial purposes (including research). You are also allowed to modify it to suit your needs. However, if you release a modified version based on these instructions, it must be released under the same CC license as our original instruction.
Anyone wishing to use the instructions for commercial purposes should contact us (see Researchers below). In this context we do not consider clinical use, educational use or the use of the videos for research activities with external funding as commercial purposes. However, we do consider marketing of QST equipment, selling modified versions etc as commercial purposes. If in doubt please contact us.

1 Design specifications
1.1 Parts
The 3P consists of ten separate parts, listed below in the same order as in the illustration above:
- A spring
- A (front) spring push plate
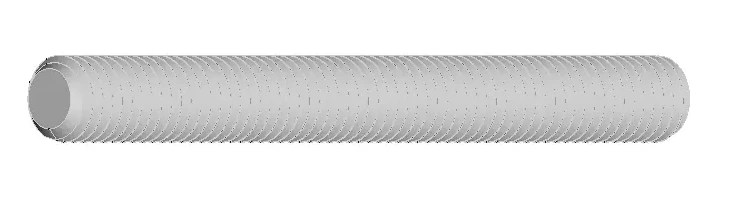
- A smooth push rod (with threaded ends)
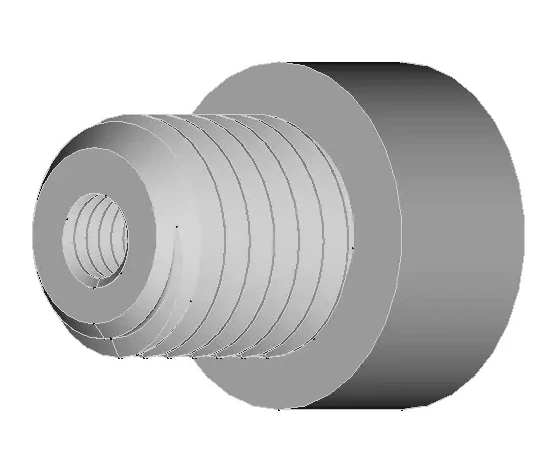
- A (front) tube plug with smooth internal bore
- A (rear) spring push plate
- A fully threaded adjustment rod
- A (rear) tube plug with threaded internal bore
- A contact sphere
- A counter lock nut with threaded internal bore
- A housing tube
The specifications for each part is provided below.
1.2 Spring
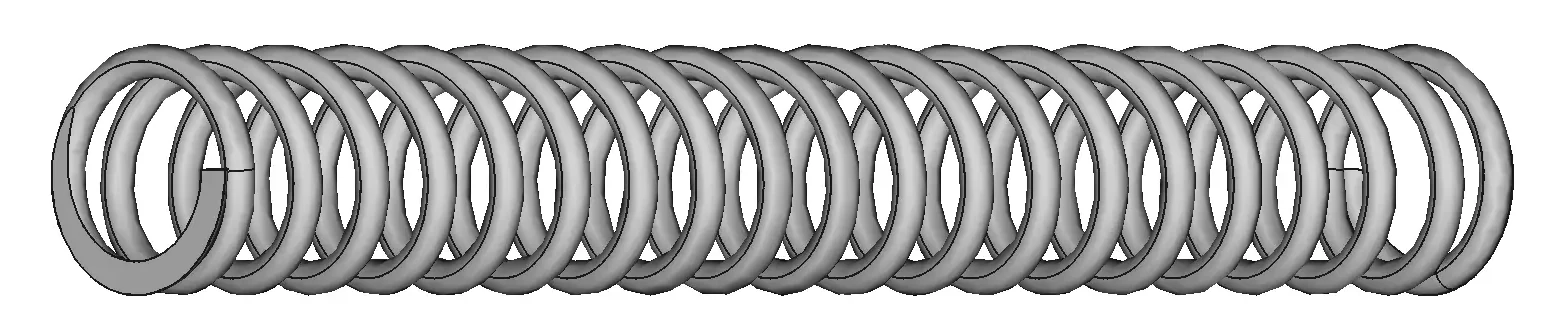
The spring you chose will depend on your particular force requirements for each pressure probe. However, the spring must comply within certain constraints to be suited:
The spring should be
- A helical compression spring (as opposed to e.g. conical or barrel springs).
- A constant pitch spring with a linear force development (as opposed to variable pitch springs).
- A spring with closed and ground ends to ensure even contact with the spring push plates. Closed and square ended spring and plain, double closed and open ended springs are not suitable.
- Manufactured from a good quality steel within relatively tight tolerances.
- You will need to procure a specific spring based on specific parameters.
Also the spring dimensions need to be considered carefully:
- The outer diameter of the spring must be smaller than the inner diameter of the housing tube or it will not fit inside it. Please note that it is the outer diameter of the spring in the compressed state which must fit inside the tube – when compressed, the spring outer diameter will increase slightly. When compressed and housed inside the tube, the spring should not make physical contact with the inner tube surface.
- The inner diameter of the spring should be greater than the outer diameter of the push rod and the threaded adjustment rod. In both the compressed and the unloaded state, the push rod and adjustment rods should fit inside the spring without making physical contact with it.
- The length of the spring when not loaded should be slightly longer than the space between the two push plates – thus a slight pre-load will take up any slack.
- If the length of the spring when not loaded is too short, a cylindrical spacer with a diameter = 13mm and suitable length to take up the slack, can be inserted between the front push plate and the spring. Note, that in case a cylindrical spacer is used to take up slack from a short spring, either a) the push rod should not extend beyond the spring push plate (as it will then contact the cylindrical spacer) or b) the cylindrical spacer should have a depression to accommodate the protruding part of the push rod.
Example For a 4kg probe a spring with the following characteristics is suitable:
- d - Wire thickness (mm) 1,25
- De - Diameter external (mm) 11,25
- Di - Diameter internal (mm) 8,75
- L0 - Length unloaded (mm) 64,00
- Ln - Length max load (mm) 21,10
- Sn - Length delta (mm) 42,90
- Fn - Maximum force at Ln (N) 85,42
- R - Spring constant (N/mm) 1,99
As the total tube length is 150mm, the threaded part of the two plugs extending into the tube are 15mm and the two push plates are 3mm, the space between the push plates which will hold the spring, will thus be 114mm.
The unloaded length of the spring in this example is 64mm, which thus leaves 50mm of empty space between the front push plate and the spring.
However, the 50mm adjustment rod should ideally be situated such that the end with the hexagon socket is approximately in the middle of the counter locking nut. This means that 50mm - (5+25mm) = 20mm of the adjustment rod will extend inside the space which will house the spring. If the rear push plate is placed at the very end of the adjustment rod, a cylindrical spacer of minimum 50mm-20mm = 30mm is thus required to take up the slack.
A suitable springs for this example can be procured commercially, e.g. from Sodemann industrial springs. The following Sodemann part numbers are suitable for 2kg, 4kg, 6kg and 8kg respectively: 12280, 12230, 22440 and C04800673000M.
2.1 Front and rear spring push plates
The function of the front and rear spring push plates is to ensure good contact and force transfer from the spring to the push rod and the adjustment rod at either end. When the spring is loaded and unloaded, the front push plate should move freely back and forth inside the tube.
- Outer diameter = 13mm
- Thickness = 3mm
- Threaded through-hole = M6 (pitch 1mm or 0.75mm – must correspond to outer threading of push rod and adjustment rod).
- Note that the spring push plates will need to be fixed in place on the push and adjustment rods using a suitable adhesive (e.g. LockTite\(^®\) 243 or similar) or alternatively a counter nut. If the push plates are not fixed in place, they can move up/down the thread and change the spring pre-load.
2.2 Push rod
The function of the push rod is to transfer force from the spring, via the front spring push plat to the contact sphere, whilst moving/sliding freely within the smooth bore of the front tube plug.

- Length = 75mm
- Diameter = 6mm
- Threading = 1cm M6 either end (pitch 1mm or 0.75mm – must correspond to inner threading of front spring push plate and contact sphere)
2.3 Front smooth bore tube plug
The front tube plug has an outer thread to secure it firmly to the housing tube and a smooth inner bore to allow the push rod to slide freely.
- Total length = 25mm
- Plug length = 10mm
- Inner threading length = 15mm (must correspond to inner threading of housing tube)
- Plug outer diameter = 20mm
- Smooth through-hole diameter = 6mm (must correspond to diameter of push rod)
2.4 Threaded adjustment rod
The threaded adjustment rod serves to adjust the spring preload via the rear push plat by being wound in/out of the rear tube threaded plug. The threaded adjustment rod has an internal hexagon socket to allow for easy adjusting with an appropriate tool.
- Length = 50mm
- Threading = M6 (pitch 1mm or 0.75mm – must correspond to spring push plates)
- NOTE the threaded adjustment rod must have an internal hexagonal socket in one end.
2.5 Rear threaded bore tube plug
The read threaded tube plug has an outer thread to secure it firmly to the housing tube and a threaded inner bore to allow the adjustment rod to be adjust in/out.
- Total length = 25mm
- Plug length = 10mm
- Inner threading length = 15mm (must correspond to inner threading of housing tube)
- Plug outer diameter = 20mm
- Threaded through-hole = M6 (must correspond to outer threading of adjustment rod)
2.6 Contact sphere
The contact sphere has an internal threaded socket (not a through hole) to allow for secure fastening to the front end of the push rod.
- Diameter = 15mm
- Threaded socket = M6 (pitch 1mm or 0.75mm – must correspond to outer threading of push rod), depth = 8mm
2.7 Counter locking nut
The counter locking nut has an internal threaded though hole similar to the read tube plug. By tightening the counter lock nut and the read tube plug on the threaded adjustment rod, the latter can be fixed in place once the probe has been calibrated.
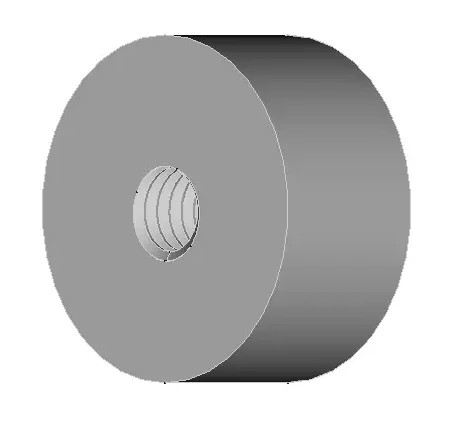
- Total length = 10mm
- Threaded through-hole = M6 (pitch 1mm or 0.75mm – must correspond to outer threading of adjustment rod)
2.8 Housing tube
The housing tube houses the internal adjustment mechanism and provides a handle for the operator to grip when using the probe.
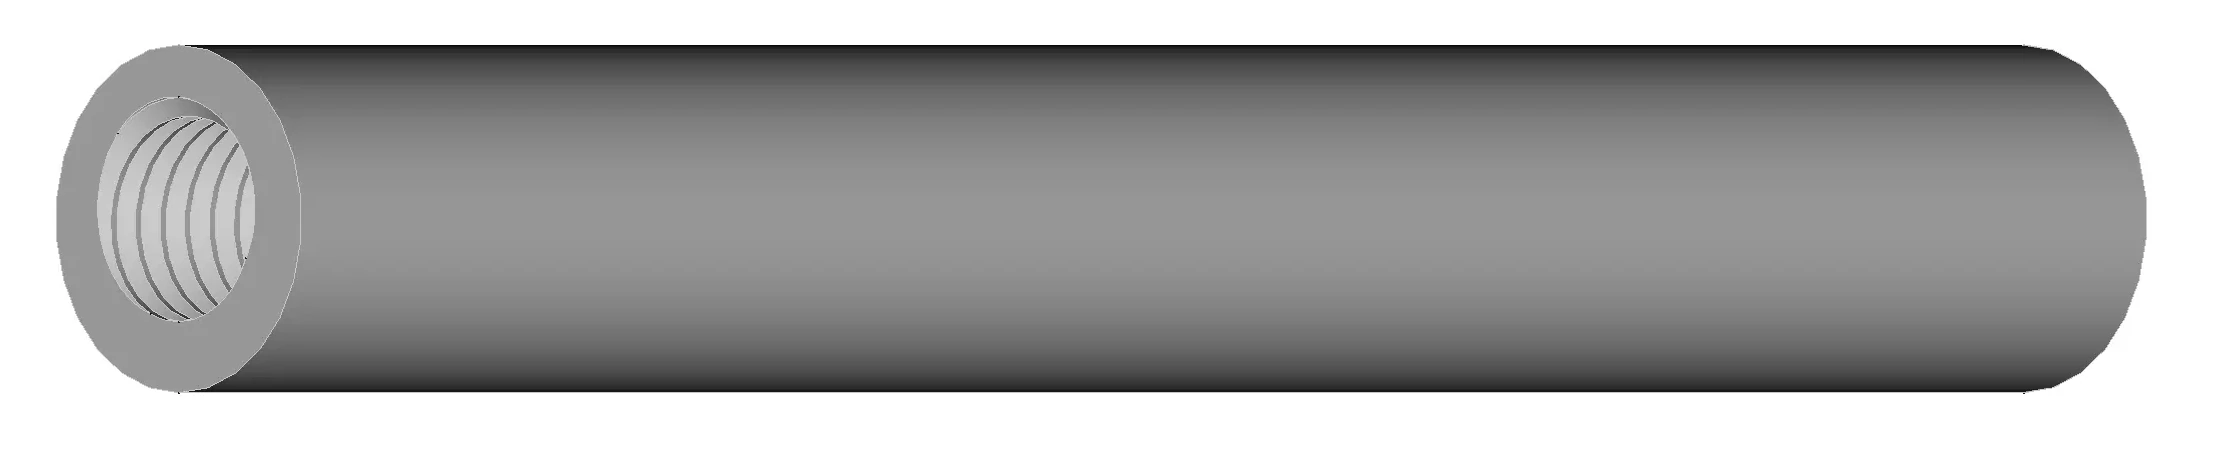
- Length = 150mm
- Outer diameter = 20mm
- Inner diameter = 14mm
- Inner threading = M14, 15mm depth only in either end of tube which must correspond to outer threading of plugs.
3 Ancillary
3.1 Sine waveform sound file
To ensure the correct rate of pressure application in temporal summation, we recommend the use of a sound cue.
We have found it difficult to approximate a square (pulse) waveform with its abrupt increases and decreases in force application. We recommend instead a sine waveform as target force application curve. A sound cue can be downloaded here.
The audio cue is introduced by three clicks, followed by a constant tone fluctuating in volume as a sine wave. The 10th sound wave is interrupted at peak volume and immediately followed by click sounds to indicate the end of the sound cue.
To allow for calibration of the Pressure Pain Probes, it will be necessary to accurately measure the force exerted by the probes when compressed.
Arguably, this could be achieved with any commercially available weight of sufficient quality, however the calibration platform described here will serve that purpose whilst also providing serial data to computer. This can be used to monitor and document the force exerted during calibration.
The design details and instructions listed here are released under a Creative Commons license.
This means you are welcome to use it for non-commercial purposes (including research). You are also allowed to modify it to suit your needs. However, if you release a modified version based on these instructions, it must be released under the same CC license as our original instruction.
Anyone wishing to use the instructions for commercial purposes should contact us (see Researchers below). In this context we do not consider clinical use, educational use or the use of the videos for research activities with external funding as commercial purposes. However, we do consider marketing of QST equipment, selling modified versions etc as commercial purposes. If in doubt please contact us.
4 Design specifications
4.1 Parts
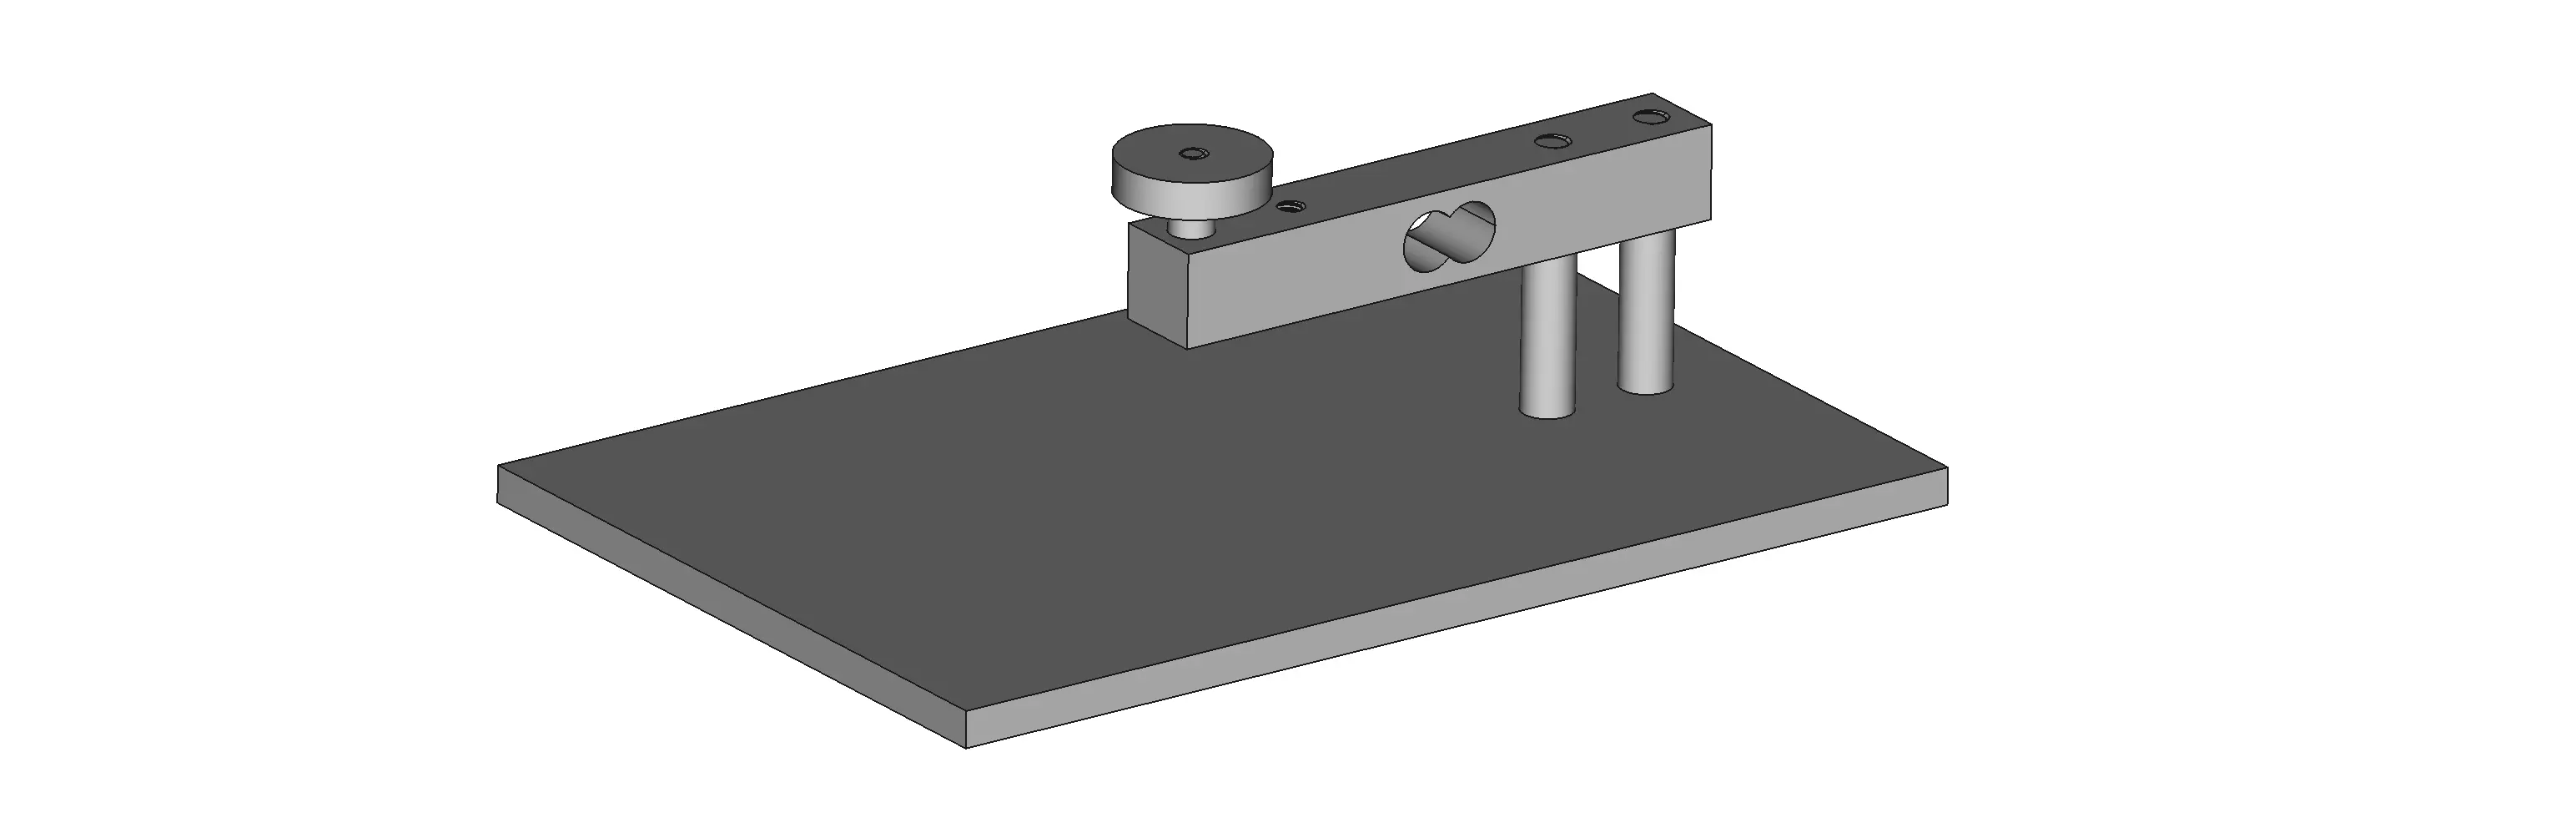
The calibration platform illustrated here is based on the design by Henrik Baare Olsen and Tue Skallgaard from the Institute of Sport Science and Clinical Biomechaincs, University of Southern Denmark.
The calibration platform consists of nine separate parts, listed below in the same order as in the illustration above:
- Two identical base platform bolts
- Two identical base platform spacers
- A base platform
- An aluminum parallel beam weighing cell
- A contact platform retaining bolt
- A contact platform spacer
- A contact platform
We recommend also using an adhesive patch in rubber or hard foam, on the contact platform – this helps prevent the pressure probe from sliding when force is applied.
The specifications for each part is provided below.
4.2 Parallel beam weighing cell
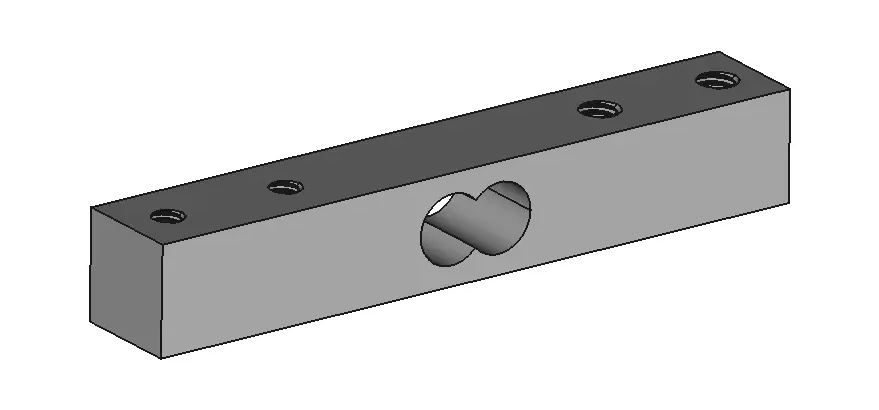
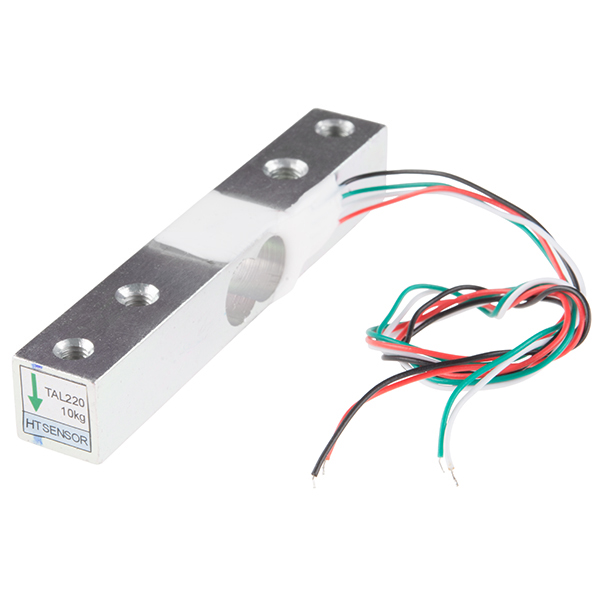
The parallel beam weighing cell is a force transducer. When one end of the bar is fixed in place and a weight is placed at the other end, it will bend very slightly in the middle, thus stretching the aluminium on the convex. The amount of stretching is too small to be visible, but sufficient to alter the electrical resistance in wires attached to the surface of the aluminium bar. This change in electrical resistance can be measured and (within the parameters of the weighing cell) is linearly related to the weight which caused the deformation.
Such pre-manufactured weighing cells can be purchased from a number of vendors and manufacturers. For calibration of the pressure pain probes, a 10kg or 20kg weighing cell of dimensions 12.7mm x 12.7mm x 80mm is appropriate. An internet search using terms like load weighing cell aluminium parallel 20kg should provide useful results.
Note that the weighing cell is directions-specific: There will be a marker on the end of the weighing cell indicating which way the loading force should be directed.
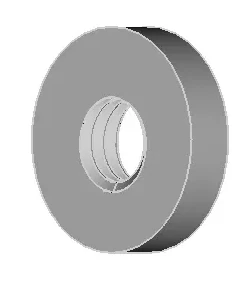
4.3 A contact platform spacer
![]()
- A metallic tube with inner diameter of 4mm (M4 through hole) and an outer diameter of 6-7mm and a length of 5mm
4.4 A contact platform bolt
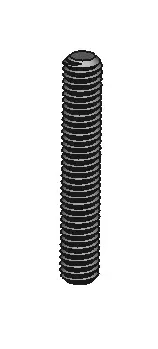
- A threaded bar with an internal hexagon socket (alternatively a cap head bolt).
- Dimensions: M4 threading, length should be 22.7mm (12.7mm + length of the contact platform spacer + thickness of the contact platform).
- NOTE The end of the contact platform bolt should be flush (level) with the upper surface of the contact platform.
4.5 A contact platform
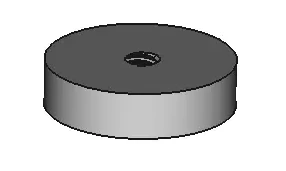
- Disk of 20-30mm diameter and a thickness of 5-10mm
- Centered and threaded (M4) through hole
- A soft foam or felt pad (not illustrated) to be attached as the contact surface for probe calibration
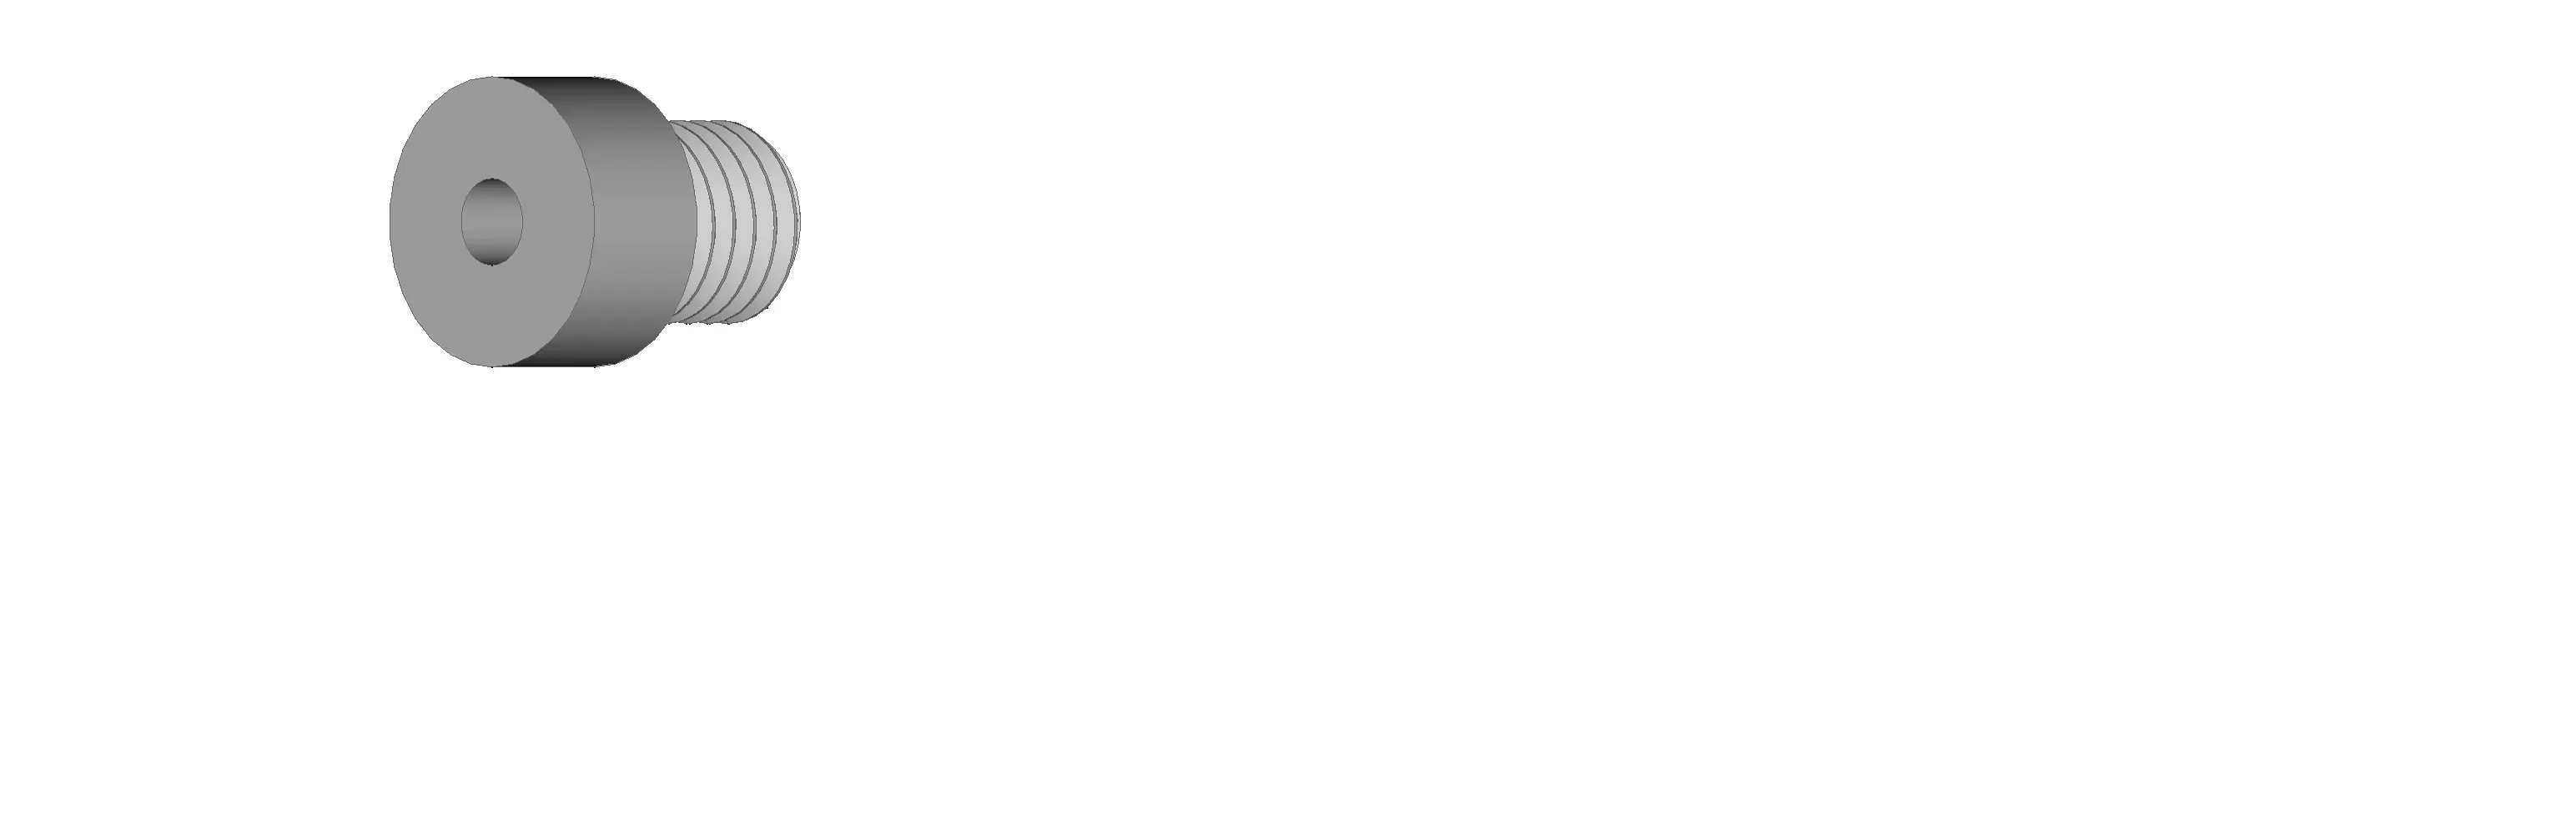
4.6 Two identical base platform spacers
![]()
- Two metallic tubes with inner diameter of 5mm (M5 through hole) and an outer diameter of 7-9mm and a length of 23mm
4.7 Two identical base platform bolts
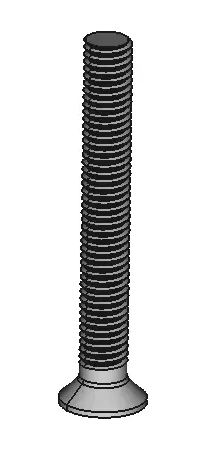
- Two counter sunk (conical head) bolts.
- Dimensions: M5 threading, length should be 40mm (approximately 12.7mm + length of the base platform spacer + thickness of the base platform).
4.8 A base platform
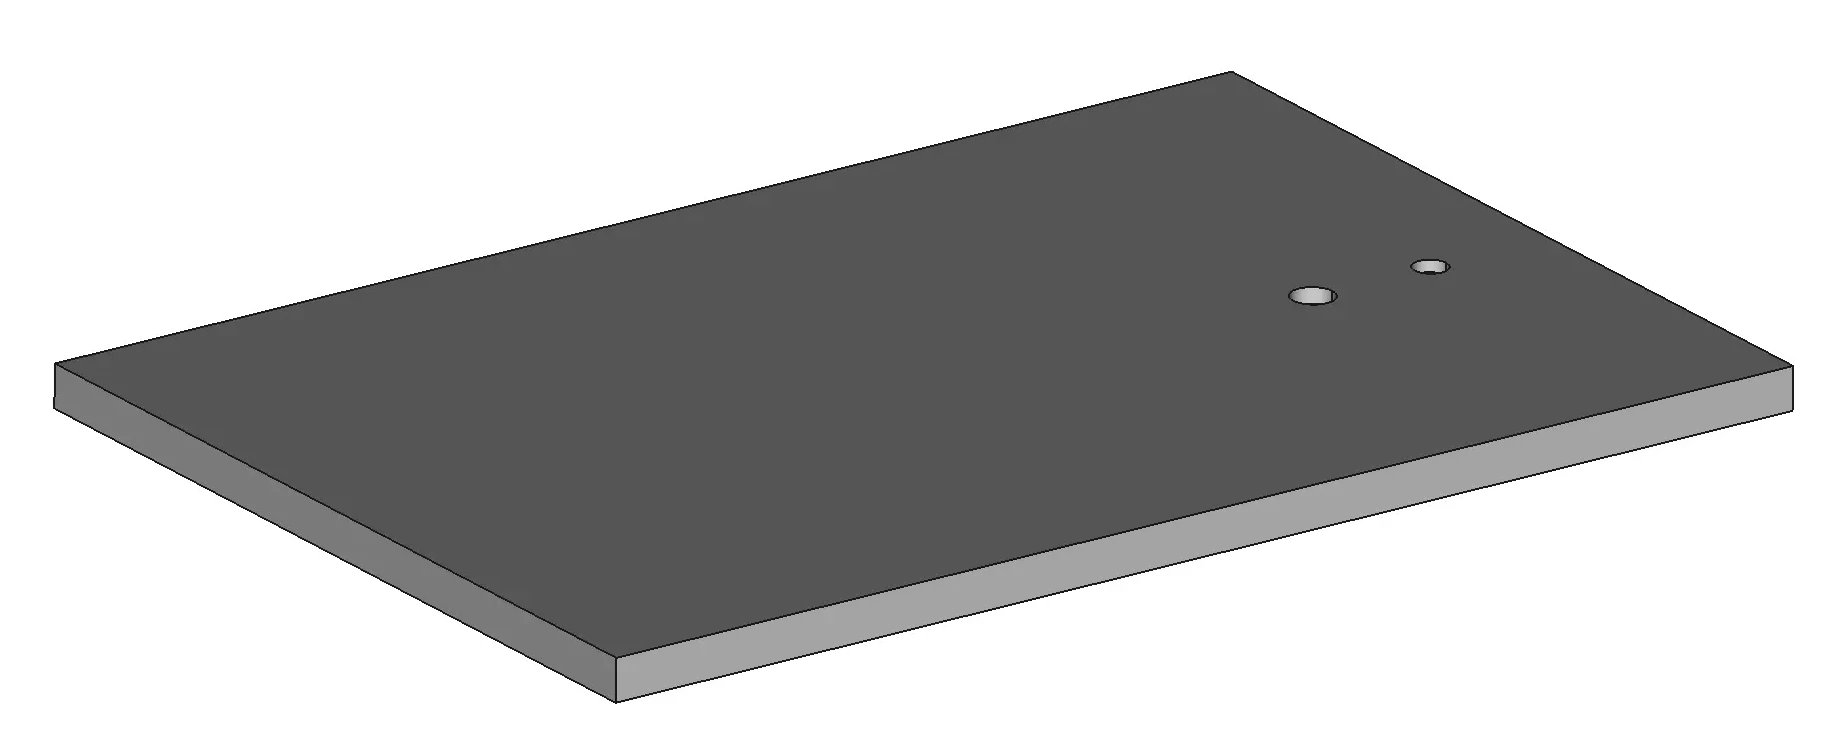
- A solid metal plate of 150mm x 100mm x 5mm
- Two counter sunk holes (M5) to accomodate the base platform bolt heads.
5 Data capture
To measure applied force (weight) the analog change in electrical resistance has to be amplified and converted to a digital signal. The digital signal has to be read and ‘translated’ into a measurement of applied force on the basis of the signal related to two known calibration weights.
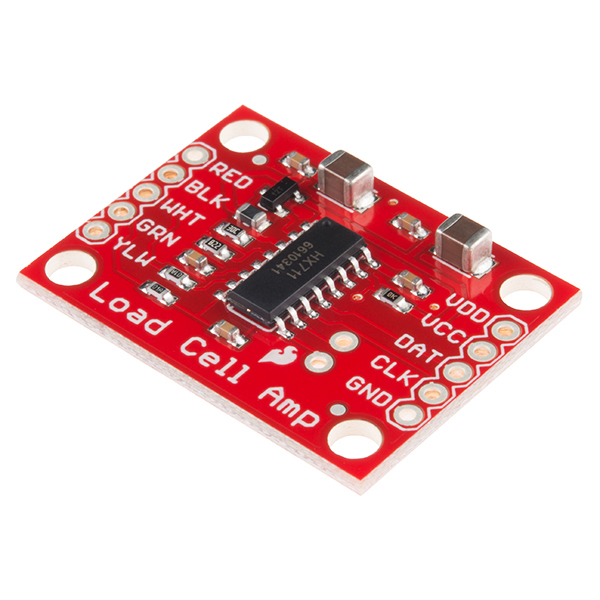
5.1 Analog-to-digital convertion
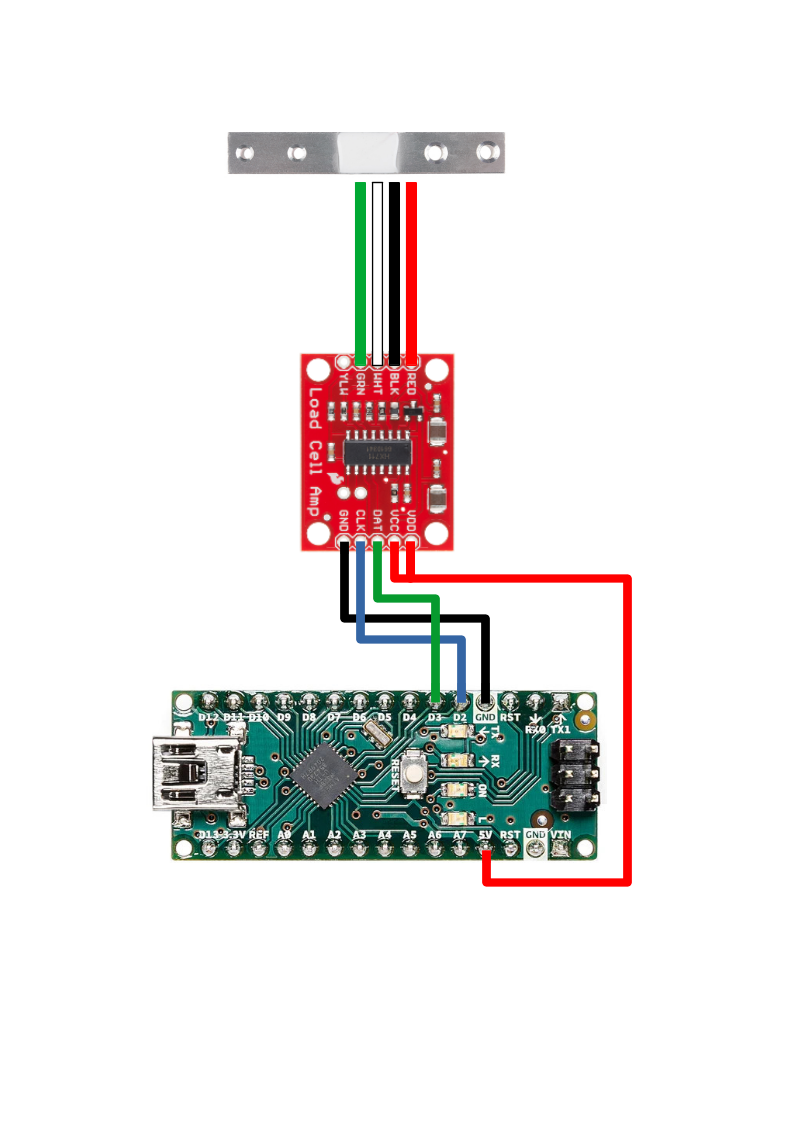
A suitable analog-to-digital converter (ADC) must be hooked up to the four wires from the weighing cell. An H711 ADC is such a suitable (and low-cost) device:
5.2 Signal processing
A suitable microprocessor PCB is needed to read the digital signal from the ADC, to handle signal calibration, transmit the serial data, etc. A large number of possible solutions are available, including several open source boards produced by Arduino. An Arduino Nano v3 is a suitable (and low cost) solution:
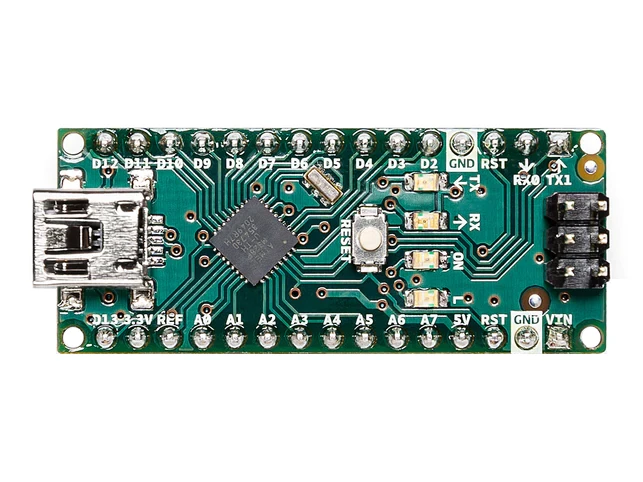
If a different microprocessor board is used, it will probably require some adaptations to the wiring diagram and/or coded provided on this page.
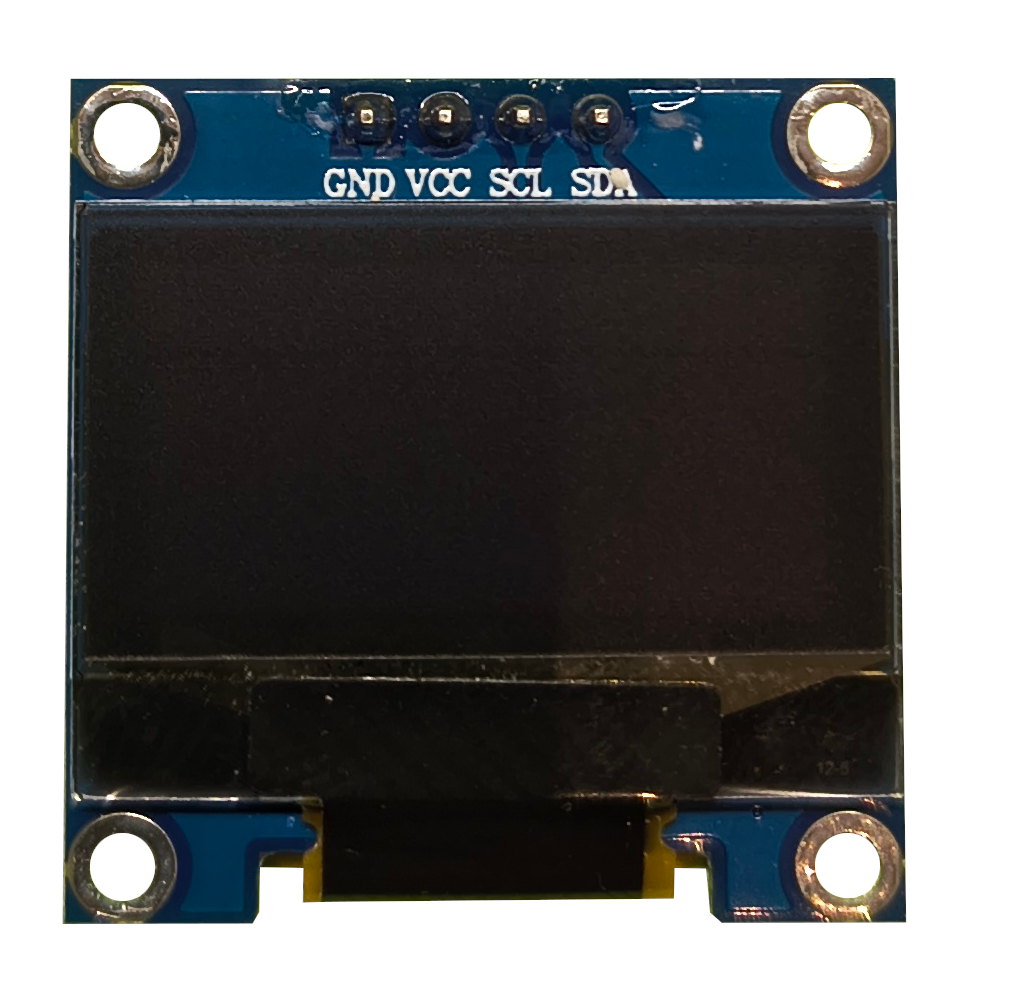
5.3 Data output
You can either use a computer connected to the Arduino to read the measurements via a suitable programm, e.g. Arduino IDE, or you can attach a separate screen to the Arduino such as a 0.96" OLED.
5.4 Wiring diagram
The wiring is relatively straight forward and simple. Note that the four wires from the weighing cell are color coded (typically), but some manufactures may have used different markings. Note, that in many cases the yellow connector will not be used.
Also not, the two short-circuited power-in connectors (VCC and VDD) on the HX711 ADC board facing the Arduino Nano board.
The Arduino Nano v3 may be provided with ‘headers’ (metal contacts) pre-soldered onto the board. In that case, rather than trying to remove the headers, simply use wires with appropriate female Dupont connectors or consider placing the Arduino in a small bread-board.
It is a very good idea to secure the HX711 ADC and the Arduino Nano board inside a robust case. Any suitably sized plastic container can be used, but do not use metal containers to avoid short-circuiting the electronics. Also, make sure to insulate the HX711 board and the Arduino PCB from each other using heat-shrink wrap or similar.
Soldering requires some degree of experience – seek help if required.
5.5 Data stream
To read data from the Arduino, it must be connected via the onboard USB connector to a computer with appropriate software installed.
In addition to hardware such as the Nano v3, Arduino (the company) also provides a free software application ‘Arduino IDE’ (currently version 2+), which can be downloaded from their website at http://www.arduino.cc
The software is available free as open source software for Linux, Mac OS and Microsoft Windows. On online version is also available. The Arduino IDE will allow for editing of the code which is to run on the Arduino Nano (such program code is called ‘sketches’), for uploading the code to the Arduino and for reading/writting serial data to the board when the sketch code is running.
If you want to store a stream of serial data to a file, the Arduino IDE is not well suited. Instead look to serial monitors like PuTTY, minicom, and others.
5.6 Data to OLED
The Arduino board can also be hooked up to a small TFT or OLED screen to display readings without the need for a connected computer.
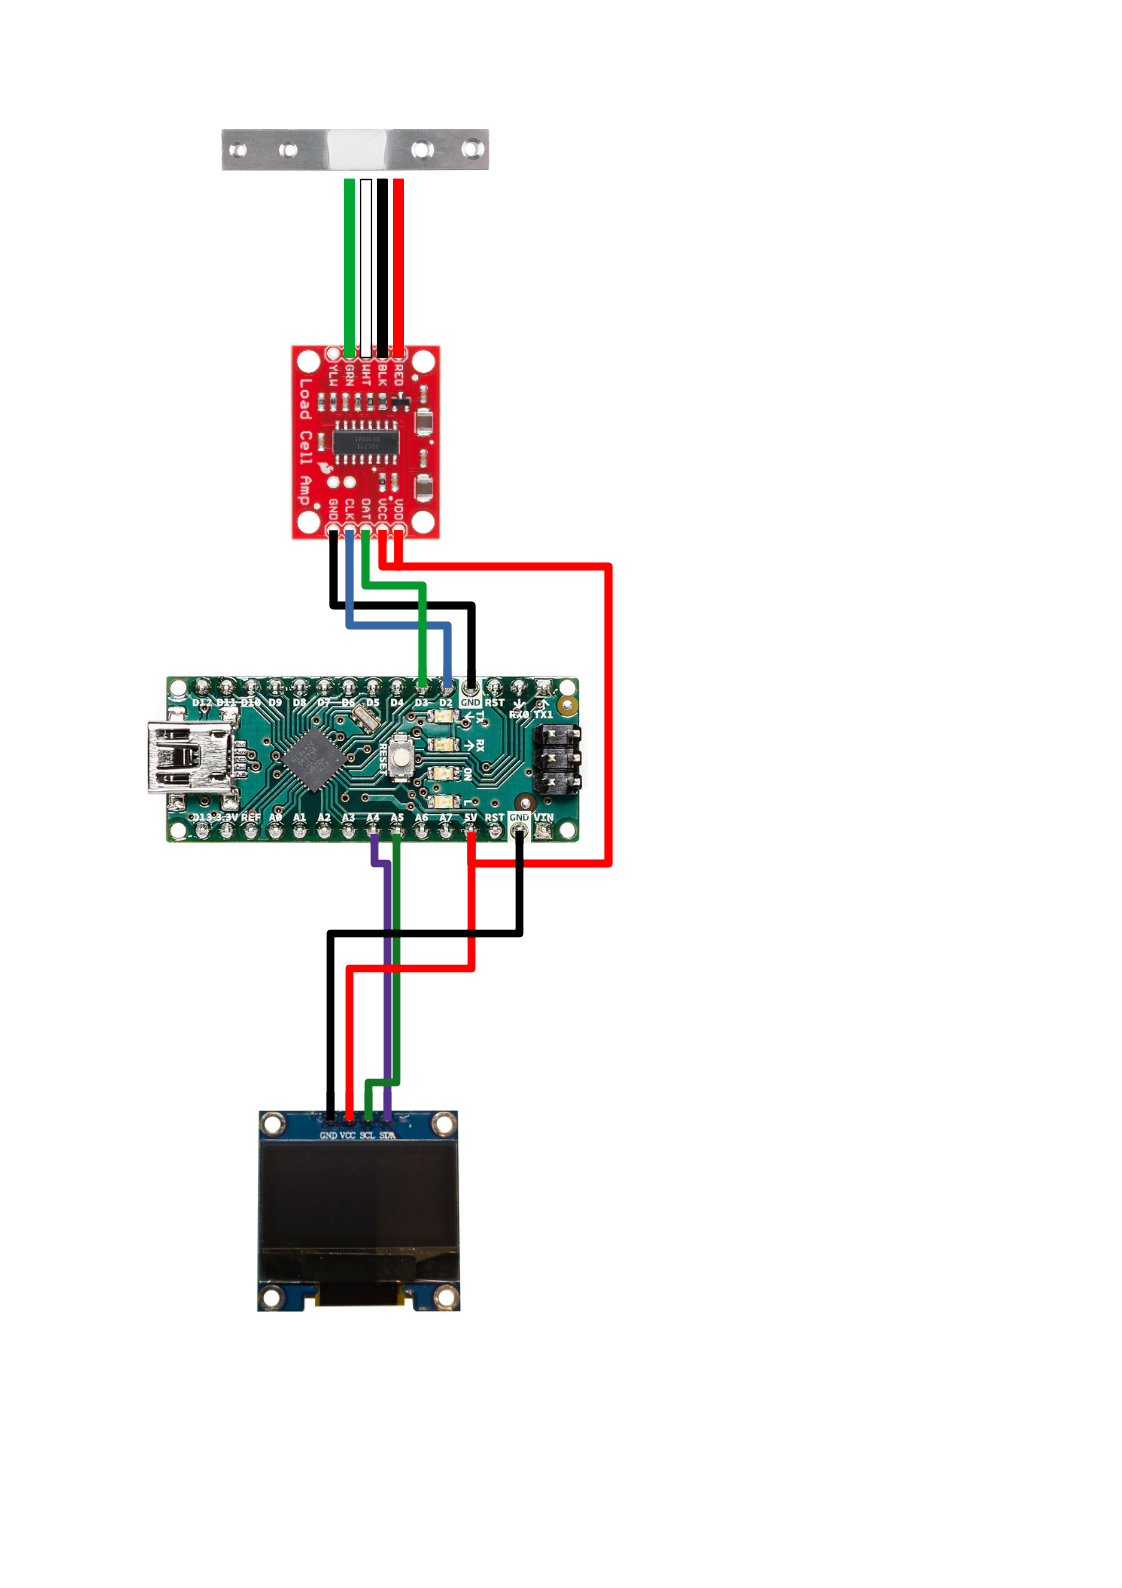
You will still occasionally need to hook the Arduino PCB up to a PC with Arduino IDE installed, in order to calibrate the weighing cell etc.
5.7 Arduino software
A simple sketch (the accepted Arduino-community term for programming code) is available !(https://gitlab.sdu.dk/soneill/equipment_calibration_platform)[here].
This code provides a minimum workable solution:
- It reads serial data from the HX711 ADC and transmits it over USB.
- It displays the weight reading on an attached OLED screen.
- It allows for calibration to known weights of 0 ‘units’ and 1 ’unit’of weight – the intended use is to calibrate in kilograms, and the software will also accept 1.02kg (100kPa at 1 cm²) and 5kg as calibration weights.
- It will store the calibration data on the Arduinos EEPROM from session to session.
The digital VAS is intended to a) capture a single VAS reading or b) capture a time series of repeated VAS readings and present summary data of those readings.
The design details and instructions listed here are released under a Creative Commons license.
This means you are welcome to use it for non-commercial purposes (including research). You are also allowed to modify it to suit your needs. However, if you release a modified version based on these instructions, it must be released under the same CC license as our original instruction.
Anyone wishing to use the instructions for commercial purposes should contact us (see Researchers below). In this context we do not consider clinical use, educational use or the use of the videos for research activities with external funding as commercial purposes. However, we do consider marketing of QST equipment, selling modified versions etc as commercial purposes. If in doubt please contact us.
6 Design specifications
6.1 Parts
The digital VAS consists of the following parts, in the same order as illustrated above:
- An ‘enclosure’ – we recommend the Hammond 1599E or similar
- A PCB support board (optional)
- A suitable micro processor which can run off a rechargeable battery .. e.g. a Wemos Lolin D32
- A 0.96" OLED screen (for example)
- A 3D printed custom cover for the OLED screen
- A push button OFF-(ON) (for example)
- A 100mm linear impedance, slide potentiometer
- A knob for the potentiometer (for example)
- A rocker switch (for example)
- A USB micro panel mount (for example)
- A Lithium ion battery (for example)
- A 3D printed or laser-cut acrylic custom lid for the cabinet
6.1.1 PCB and PCB holder
If the VAS-box is to work without an external power supply, the microprocessor PCB should support power-in via a battery, and preferrably a rechargable Lithium ion battery.
The Wemos Lolin 32 is a suitable choice, but many others are available.
In the illustration above, we have manufactured a PCB support board from 3mm acrylic to secure the micro processor PCB inside the enclosure. For this we made use of four of the six elevated mounting holes in the floor of the enclosure. Note that Hammond supplies a pre-manufactured PCB board for the 1599E enclosure – consider ordering it along with the enclosure itself.
Mounting holes in the PCB support board should be drilled to accommodate the chosen micro processor PCB.
Depending on the enclosure used, be aware of the limited space inside for all of the components.
6.1.2 OLED and cover
A \(0.96\)" OLED screen is sufficient to display VAS information and small enough to fit the lid of the enclosure. Note that different makes and models of such OLEDs may have slightly different dimensions and the enclosure-lid cut-out and OLED cover should accommodate the chosen OLED. Note also the corners in the OLED cut-out which supports the OLEDs mounting holes.
The OLED and the cover can be fixed to the lid using an appropriate glue and/or by screws through the cover, OLED mounting holes and pre-drilled holes in the box lid. Be careful not to apply force to the OLED screen during installation.
6.1.4 USB Micro panel mount
A USB connection to the micro processor will be required to a) communicate with a PC and, more commonly, b) to recharge the Lithium ion battery which powers the system. It is possible to simply open the enclosure to gain access to the USB connector of the micro processor PCB, when required. However, it is more practical and safer to install a USB extension with a panel-mounted connector, eliminating the need to frequently open the case.
6.1.6 Battery
A good quality Lithium ion battery (\(3.7\)V) with an appropriate connector for the micro processor PCB.
6.1.7 Enclosure with custom lid
The lid of the enclosure needs to be adapted to house an OLED screen, a slide potentiometer and a push button.
If a CNC machine is available, the customized lid can be machined from the lid that is supplied with the Hammond 1599E enclosure. Alternatively, create a replacement lid using a laser cutter and a suitable 5mm thick acrylic material or print a replacement lid by means of a 3D printer.
6.2 Instructions for use
This applies to the VAS timer software (v1 april 2025)
6.2.1 Power up
During power up, a short beep sound will play and the screen will briefly display:
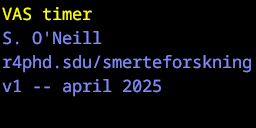
Note, the version number and time stamp in the last line. After a short pause, the device will display a reading of the battery charge status (0-100):

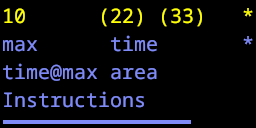
After another short pause, the programme skips to running mode and will display a version of the following screen:
6.2.2 Two separate modes
The Digital VAS software will run in one of two different modes, indicated by either of the two stars in the upper right hand corner:
- Single VAS measures – a yellow star in the first line
- Time series VAS measures – a blue star in the second line
When starting up, the software defaults to the Single VAS measures mode and only the first line (yellow) is displayed on-screen.
6.2.3 Single VAS measures
Moving and positioning the slider between the far left and far right positions, does not affect the on-screen information – until the push-button is depressed and released.
When the push-button is pressed and released in the Single VAS measure mode, a single measure of the VAS position is recorded and displayed on screen in the left most position of line 1 (10 in the example above).
The previous two measures are displayed in parentheses (22 and 33). In this manner the three latest measurements are all available on-screen, left-to-right.
When pressing the push-button in Single VAS measures mode, a blue progress bar appears in the lower edge of the screen from left-to-right. This line disappears again when the button is released. In order to complete a single VAS measurement, the button should be released before the blue progress bar reaches the right screen edge.
6.2.4 Time series VAS measures
To enter the Time series VAS measures mode, place the VAS slider in the far left position (VAS=0), press and hold the push-button and keep it pressed until the blue progress bar reaches the right screen edge.
When the button is released, a sound and on-screen message will indicate that: “Time series starting”. The sound will indicate a short count-down with a quick burst of three short beeps, followed by three short beeps and a long beep: The screen will indicate that the Time series VAS measures mode is now running with a blue star in line two (far right hand side).
The VAS slider position is sampled with a frequenzy of 1Hz and four measures are continuously updated and displayed on-screen:
- max: the highest VAS position registred so far
- time: the current time passed since Time series VAS measures mode started (in seconds)
- time@max: the first time stamp (in seconds) of the max VAS reading
- area: the cumulated area of VAS measures over time
The Time series VAS measures mode can be interrputed by pressing and releasing the push-button at any time. This will be accompanied by a sound cue and will cause a return to the Single VAS measures mode. Note that the latest Time series VAS measures data will remain visible on-screen until a new Time series VAS measures is started or the device is turned off.
If the Time series VAS measures mode is not interrupted by 120 seconds, a sound cue will signal that test time is up, and the device will return to the Single VAS measures mode.
Note: The VAS slider must be set to 0 to initiate the Time series VAS measures mode, otherwise a warning will be presented on screen along with a warning sound.
The Arduino skecth code for the Digital VAS device, version v1 – april 2025 is listed here:
 #if !defined( ESP32 )
    #error This code is intended to run on the ESP32 platform! Please check your Tools->Board setting.
 #endif

#include <SPI.h>
#include <Wire.h>
#include <Adafruit_GFX.h>
#include <Adafruit_SSD1306.h>

// Analog VAS pin definition
#define SENSOR_PIN 32  // Linear actuator to ADC
#define BUZZER 4
#define BUTTON 17
#define SCREEN_WIDTH 128 // OLED display width, in pixels
#define SCREEN_HEIGHT 32 // OLED display height, in pixels

#define OLED_RESET -1 // Reset pin # (or -1 if sharing Arduino reset pin)
#define SCREEN_ADDRESS 0x3C ///< See datasheet for Address; 0x3D for 128x64, 0x3C for 128x32
Adafruit_SSD1306 display(SCREEN_WIDTH, SCREEN_HEIGHT, &Wire, OLED_RESET);

// Battery voltage indicator
const int PINbattery = 35;

// btn refers to the physical button state -- bouncing and all ...
byte btn_state = LOW;
byte btn_state_changed = false;
int btn_state_change_time = 0;

int btn_goes_high_time = 0; // time at which btn was observed to go HIGH
int btn_goes_low_time = 0; // time at which btn was observed to go LOW

// click refers to the logical assessment of btn -- anything stable over 100ms is considered non-bounce state
byte click_state = LOW;
boolean click_state_changed = false;
boolean click_state_uncertain = true;
int click_high_time = 0; // at what time did click start
int click_high_duration = 0; // how long was click before release
int click_low_time = 0; // at what time did click stop
int click_low_duration = 0; // how long was unclicked before click

// program series refers to the continuous recording of VAS values of a given period of time
boolean program_series = false; // single measurement (false) or time series (true)
boolean program_show = false; // show measurements onscreen (true) or not (false)
int program_series_running_time_s = 120; // for time series -- recording time (seconds)
int program_series_running_time_m = 1000 * program_series_running_time_s; // for time series -- recording time (milliseconds)
int program_series_freq_s = 1; // for time series -- frequency of measurements in seconds
int program_series_freq_m = 1000 * program_series_freq_s; // for time series -- frequency of measurements in milliseconds
int program_series_start_time = 0;
int program_series_counter = 0; // counter for measurements in series
int program_series_vas_max = 0;
int program_series_vas_time_to_max = 0;
int program_series_vas_time = 0;
int program_series_vas_area = 0;

int vas_previous1 = 0;
int vas_previous2 = 0;
int vas_current = 0;

void setup() {
    pinMode(BUZZER, OUTPUT);
    pinMode(SENSOR_PIN, INPUT);
    pinMode(BUTTON, INPUT);
    tone(BUZZER, 1000, 100);

    if(!display.begin(SSD1306_SWITCHCAPVCC, SCREEN_ADDRESS)) {
        Serial.println(F("SSD1306 allocation failed"));
        for(;;); // Don't proceed, loop forever
    }
    display.clearDisplay();
    display.setTextSize(1);      // Normal 1:1 pixel scale
    display.setTextColor(SSD1306_WHITE, SSD1306_BLACK); // Draw white text
    display.cp437(true);
    display.setCursor(0*8, 0*8); display.println("VAS timer");
    display.setCursor(0*8, 1*8); display.println("S. O'Neill");
    display.setCursor(0*8, 2*8); display.println("r4phd.sdu/smerteforskning");
    display.setCursor(0*8, 3*8); display.println("v1 -- april 2025");
    display.display();

    analogReadResolution(12);  // ESP32 ADC resolution (0-4095)

    pinMode(BUTTON, INPUT_PULLUP);

    delay(1000);
    display.clearDisplay();
    display.setCursor(0*8, 0*8); display.println((int) analogRead(PINbattery)/25);
    display.display();
    delay(500);

    display.clearDisplay();
    display.display();
    btn_state_changed = false;
    click_state_changed = false;
    click_state_uncertain = true;
    program_series = false;
}

void loop() {
    // In relation to the button...
    // We are really only interested in a change in btn status (either way)
    // which happened 100ms seconds ago -- i.e the first observation of
    // no further btn state change after at least 100ms - anything less is a bounce
    byte old_state = btn_state;
    btn_state = digitalRead(BUTTON);
    if (old_state != btn_state) {
        btn_state_changed = true;
        btn_state_change_time = millis();
    }

    if (btn_state_changed) {
        if (btn_state == HIGH) {
            btn_goes_high_time = btn_state_change_time;
        }
        if (btn_state == LOW) {
            btn_goes_low_time = btn_state_change_time;
        }
        btn_state_changed = false;
        click_state_uncertain = true;
    }

    if (click_state_uncertain & btn_state == HIGH & (millis() > btn_goes_high_time + 100)) {
        // Button is pressed (click-on) and has been for 100+ ms
        click_state = HIGH;
        click_high_time = millis(); // at what time did click start
        click_high_duration = 0;
        click_state_changed = true;
        click_state_uncertain = false;
    }

    if (click_state_uncertain & btn_state == LOW & (millis() > btn_goes_low_time + 100)) {
        // Button is released (click-off) and has been for 100+ ms
        click_state = LOW;
        click_low_time = millis(); // at what time did click start
        click_low_duration = 0;
        click_state_changed = true;
        click_state_uncertain = false;
        display.drawLine(0, 31, 127, 31, SSD1306_BLACK); display.display();
    }

    if (click_state_changed) {
        if (click_state == LOW) {
            // I.e click was just released
            click_high_duration = millis() - click_high_time;
            if (click_high_duration < 3000) {
                // A short duration click to either display single vas or stop program series
                if (program_series == false){ // Update with a single measurement
                    tone(BUZZER, 1000, 10);
                    vas_previous2 = vas_previous1;
                    vas_previous1 = vas_current;
                    vas_current = map(analogRead(SENSOR_PIN), 0, 4095, 0, 100);  // Scale to 0-100
                    display.setCursor(0, 0); display.print("                 "); // 16 blanks
                    display.setCursor(0, 0); display.print(vas_current);
                    display.setCursor(60, 0); display.print("("); display.print(vas_previous1); display.print(")  ");
                    display.setCursor(96, 0); display.print("("); display.print(vas_previous2); display.print(")  ");
                    display.setCursor(15*8,0); display.print("*");
                    display.setCursor(15*8,8); display.print(" ");
                    display.display();
                } else {
                    program_series = false;
                    display.setCursor(15*8,0); display.print("*");
                    display.setCursor(15*8,8); display.print(" ");
                    display.display();
                    tone(BUZZER, 600, 100); delay(200); tone(BUZZER, 800, 100); delay(200); tone(BUZZER, 1000, 100); delay(200);
                }
            } else {
                //A long button press to indicate start of program series
                int rawValue = analogRead(SENSOR_PIN);     // Read ADC value (0-4095)
                vas_current = map(rawValue, 0, 4095, 0, 100);  // Scale to 0-100
                if (vas_current != 0) {
                    display.setCursor(0, 25);
                    display.println("SET VAS TO ZERO");
                    display.display();
                    tone(BUZZER, 200, 2000); delay(2000);
                    display.setCursor(0, 25);
                    display.println("                  ");
                    display.setCursor(15*8,0); display.print("*");
                    display.setCursor(15*8,8); display.print(" ");
                    display.display();
                    program_series = false;
                }
                if (vas_current == 0) {
                    display.fillRect(0, 8, 127, 63, SSD1306_BLACK); // clear blue area
                    display.setCursor(0, 25);
                    display.println("Time series starting");
                    display.display();
                    tone(BUZZER, 1000, 50); delay(100); tone(BUZZER, 1000, 50); delay(100); tone(BUZZER, 1000, 50); delay(600);
                    tone(BUZZER, 1000, 500); delay(1000); tone(BUZZER, 1000, 500); delay(1000); tone(BUZZER, 1000, 500); delay(1000); tone(BUZZER, 2000, 1000); delay(1000);
                    program_series = true;
                    program_series_start_time = millis();
                    program_series_counter = 0;
                    program_series_vas_max = 0;
                    program_series_vas_time_to_max = 0;
                    program_series_vas_area = 0;
                    display.setCursor(0, 25);
                    display.println("                    ");
                    display.setCursor(15*8,0); display.print(" ");
                    display.setCursor(15*8,8); display.print("*");
                    display.display();
                }
            }
        }
        // if (click_state == HIGH) ... don't do anything
        click_state_changed = false;
    }

    if (program_series == true) {
        // Check whether it is time for a new measurement
        if (millis() > (program_series_start_time + ((program_series_counter +1) * program_series_freq_m))) {
            program_series_counter++;
            int rawValue = analogRead(SENSOR_PIN);     // Read ADC value (0-4095)
            vas_current = map(rawValue, 0, 4095, 0, 100);  // Scale to 0-100
            program_series_vas_area += (program_series_freq_s * vas_current);
            if (vas_current > program_series_vas_max) {
                program_series_vas_max = vas_current;
                program_series_vas_time_to_max = program_series_counter * int (program_series_freq_s);
            }
            // Update onscreen results
            display.setCursor(0, 0);
            display.print("   ");
            display.setCursor(0, 0);
            display.print(vas_current);
            display.setCursor(0, 8);
            display.println(program_series_vas_max);
            display.setCursor(0, 16);
            display.println(program_series_vas_time_to_max);
            display.setCursor(60, 8);
            display.println(program_series_counter); // this should be seconds instead of counter (in case different freq)
            display.setCursor(60, 16);
            display.println(program_series_vas_area);
            display.display();
        }

        // Check for program series time out
        if (millis() > program_series_start_time + program_series_running_time_m) {
            tone(BUZZER, 2000, 500); delay(1000); tone(BUZZER, 2000, 500); delay(1000); tone(BUZZER, 2000, 500); delay(1000); tone(BUZZER, 1000, 1000); delay(1000);
            program_series = false;
            display.setCursor(15*8,0); display.print("*");
            display.setCursor(15*8,8); display.print(" ");
            display.display();
        }
    }

    if (click_state == HIGH) {
        int btnProgress = map(millis() - click_high_time, 0, 3000, 0, 128);
        display.drawLine(0, 31, btnProgress, 31, SSD1306_WHITE); display.display();
    }

}
This page lists instructional videos for QST testing. Please note up front, the audio tracks are all in Danish, but we will provide print-outs of the instructions to allow for dubbing the videos with audio tracks in other languages.
The videos are released under a Creative Commons license.
This means you are welcome to use the videos for non-commercial purposes (including research). You are also allowed to modify the videos to suit your needs. However, if you release a modified video, it must be released under the same CC license as our original video. This includes videos with a modified sound track, such as other languages.
Anyone wishing to use the videos for commercial purposes should contact us (see Researchers below). In this context we do not consider clinical use, educational use or the use of the videos for research activities with external funding as commercial purposes. However, we do consider marketing of QST equipment, selling modified videos etc as commercial purposes. If in doubt please contact us.
6.3 Production Company
The technical and artistic side of things..
The videos were produced by LionArt, Denmark.
LionArt retains the original raw video recordings, including material not used in the finished, released videos. LionArt is thus able to help produce professional quality, modified versions of the videos including footage and sound currently used. Furthermore, LionArt can be of assistance in producing new videos. Feel free to contact the production company:

Visit the LionArt webpage or drop them an email at leon@lionart.dk
6.4 Researchers
The scientific and procedural side of things..
We had the videos produced for use in our research activities at the Medical Spine Research section of the Spinecenter of Southern Denmark. The intention is to provide concise and standardized information for research participants and/or research assistants.
The videos are released under a Creative Commons license, in the hope that they may prove useful to other researchers in the area.
You may use the videos freely in accordance with the CC license, but we would very much appreciate being informed if you do make use of them, and in what context you use them.
- Address: S. O’Neill, Rygcenter Syddanmark, Kolding Sygehus, Sygehusvej 26, 6000 Kolding, Denmark
- Phone: +45 76 36 20 00
- Email: soeren.oneill@rsyd.dk
- Head of Research, Assoc. Clin. Prof. Søren O’Neill, PhD
- Post-doc Casper Glissmann Nim, MSc
- PhD-stud Johanne Brinch Filtenborg, MSc
- Project coordinator Sabine Hildebrandt, MSc
- Liam Holm, M.Sc.
- Prof. Henrik Bjarke Vægter, PhD
6.4.1 Videos
Download the videos..
- VerteTrack
- Cold-pressor Test
- Cuff dose/response
Cuff temporal summation..not currently available- Hypertonic saline
- Pressure Pain Intensity
- Pressure Pain Threshold
- Temporal Summation
- von Frey
:::
2 Example solutions for 2, 4, 6 and 8 kg pressure probes
2kg
4kg
6kg
8kg